![]() by Arash Ghafouri December 31, 2019
by Arash Ghafouri December 31, 2019
Iran’s economy has seen many fluctuations since 2008, with inflation and the USD-Rial exchange rate playing a big role in the instability of Iranian monetary values, particularly in 2017.
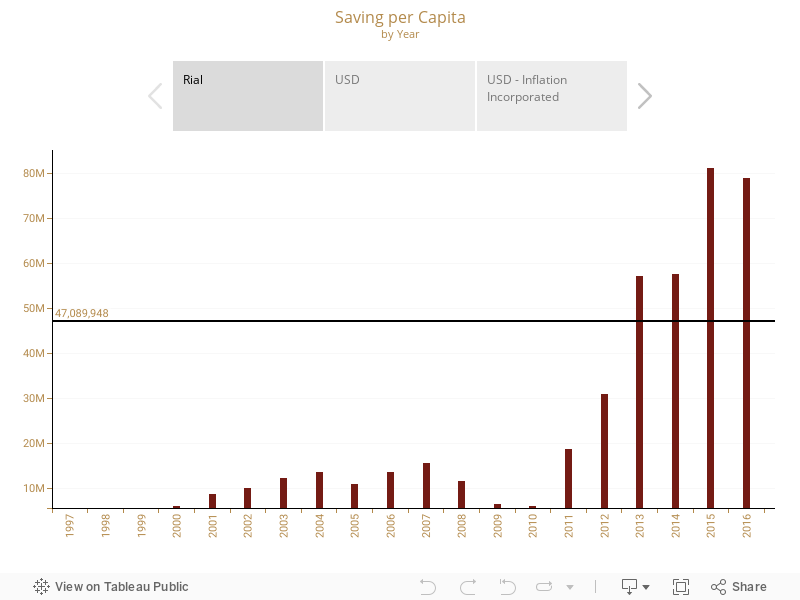
Data analysis shows that Iranians’ savings accounts (on a per capita basis among those who have a savings account) grew consistently from 1998 to 2004. After some volatility between 2005 and 2010, they again increased from 2011 to 2015. However, when inflation and the USD-Rial exchange rate is taken into account, the data shows that the value of Iranians’ savings accounts have fallen, especially in 2017.
Iranians lost USD 260 in 2012
For instance, savings per capita in 2012 show that although Iranians had 12 million more Rials per capita than in 2011, once USD exchange rates are factored in, Iranians lost 195 USD per capita. Moreover, when the inflation rate of this period (around 30 percent) was incorporated in the analysis, the difference was around 260 USD.
This chart does not demonstrate on a cellphone properly
2017 vs. 2002
A similar scenario on a smaller scale happened between 1998 and 1999 as well. To better understand the role of inflation and the USD-Rial exchange rate, Iranians’ savings in 2017 will be compared to the years between 1997 and 2005. In 2017, Iranians had around 47 million Rials in their savings accounts (per capita for those with a savings account). This is almost five times more than in 2002. However, comparing these 2 years and considering the USD-Rial exchange and inflation rate shows that Iranians had 1,052 USD per capita in their savings accounts, which is almost the same as in 2002, when their savings were at 1,046 USD per capita. This number is, however, simplified for the sake of ease of understanding, and a compound inflation rate would render worse results.
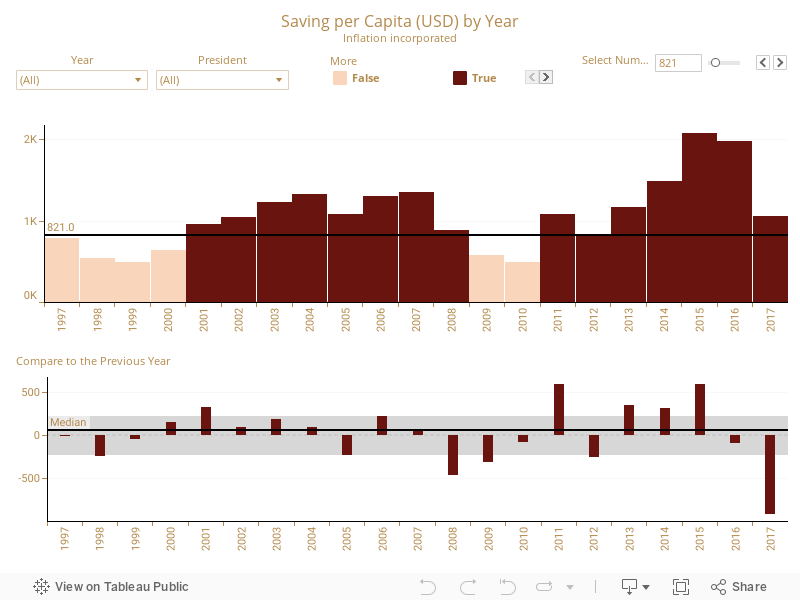
For Iranians, 2017 was a disastrous year. After their savings accounts rose to the highest value in the last twenty years in 2015 and 2016, they dropped dramatically in 2017. As the chart clearly demonstrates, a plunge in the value of Iranians’ savings took place eight times over the last twenty years: 2017 was the most severe, with 2008 and 2012 following behind.
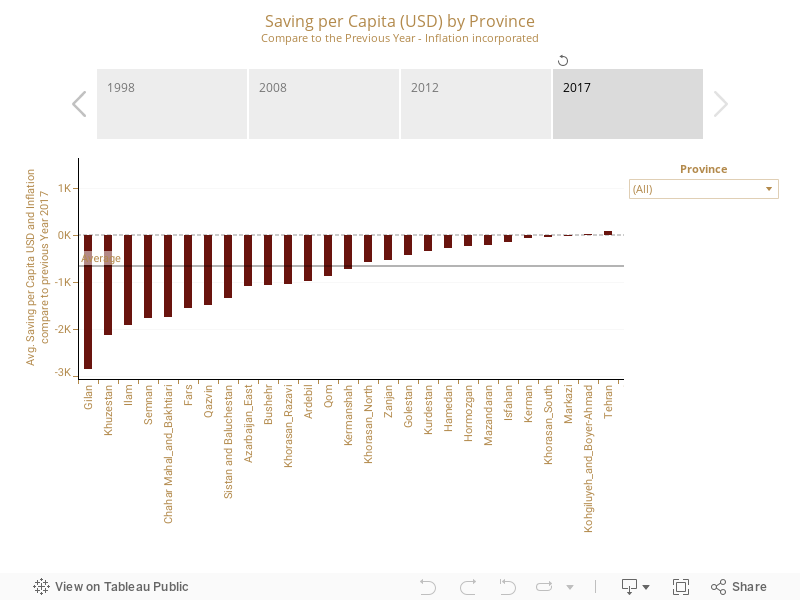
Losses on the Province Level
Additionally, the charts below break down savings per capita by provinces, comparing 2017 to other major losses in previous years (1998, 2008, and 2012). It indicates that residents of Gilan, Khuzestan, and Ilam suffered greater losses in their savings accounts than any other provinces in 2017. Iranians on average lost 662 USD between 2016 and 2017, and residents of 14 provinces were below the average line. There are just 6 provinces that saw gains; among them, Alborz ranked first.
This chart does not demonstrate on a cellphone properly.
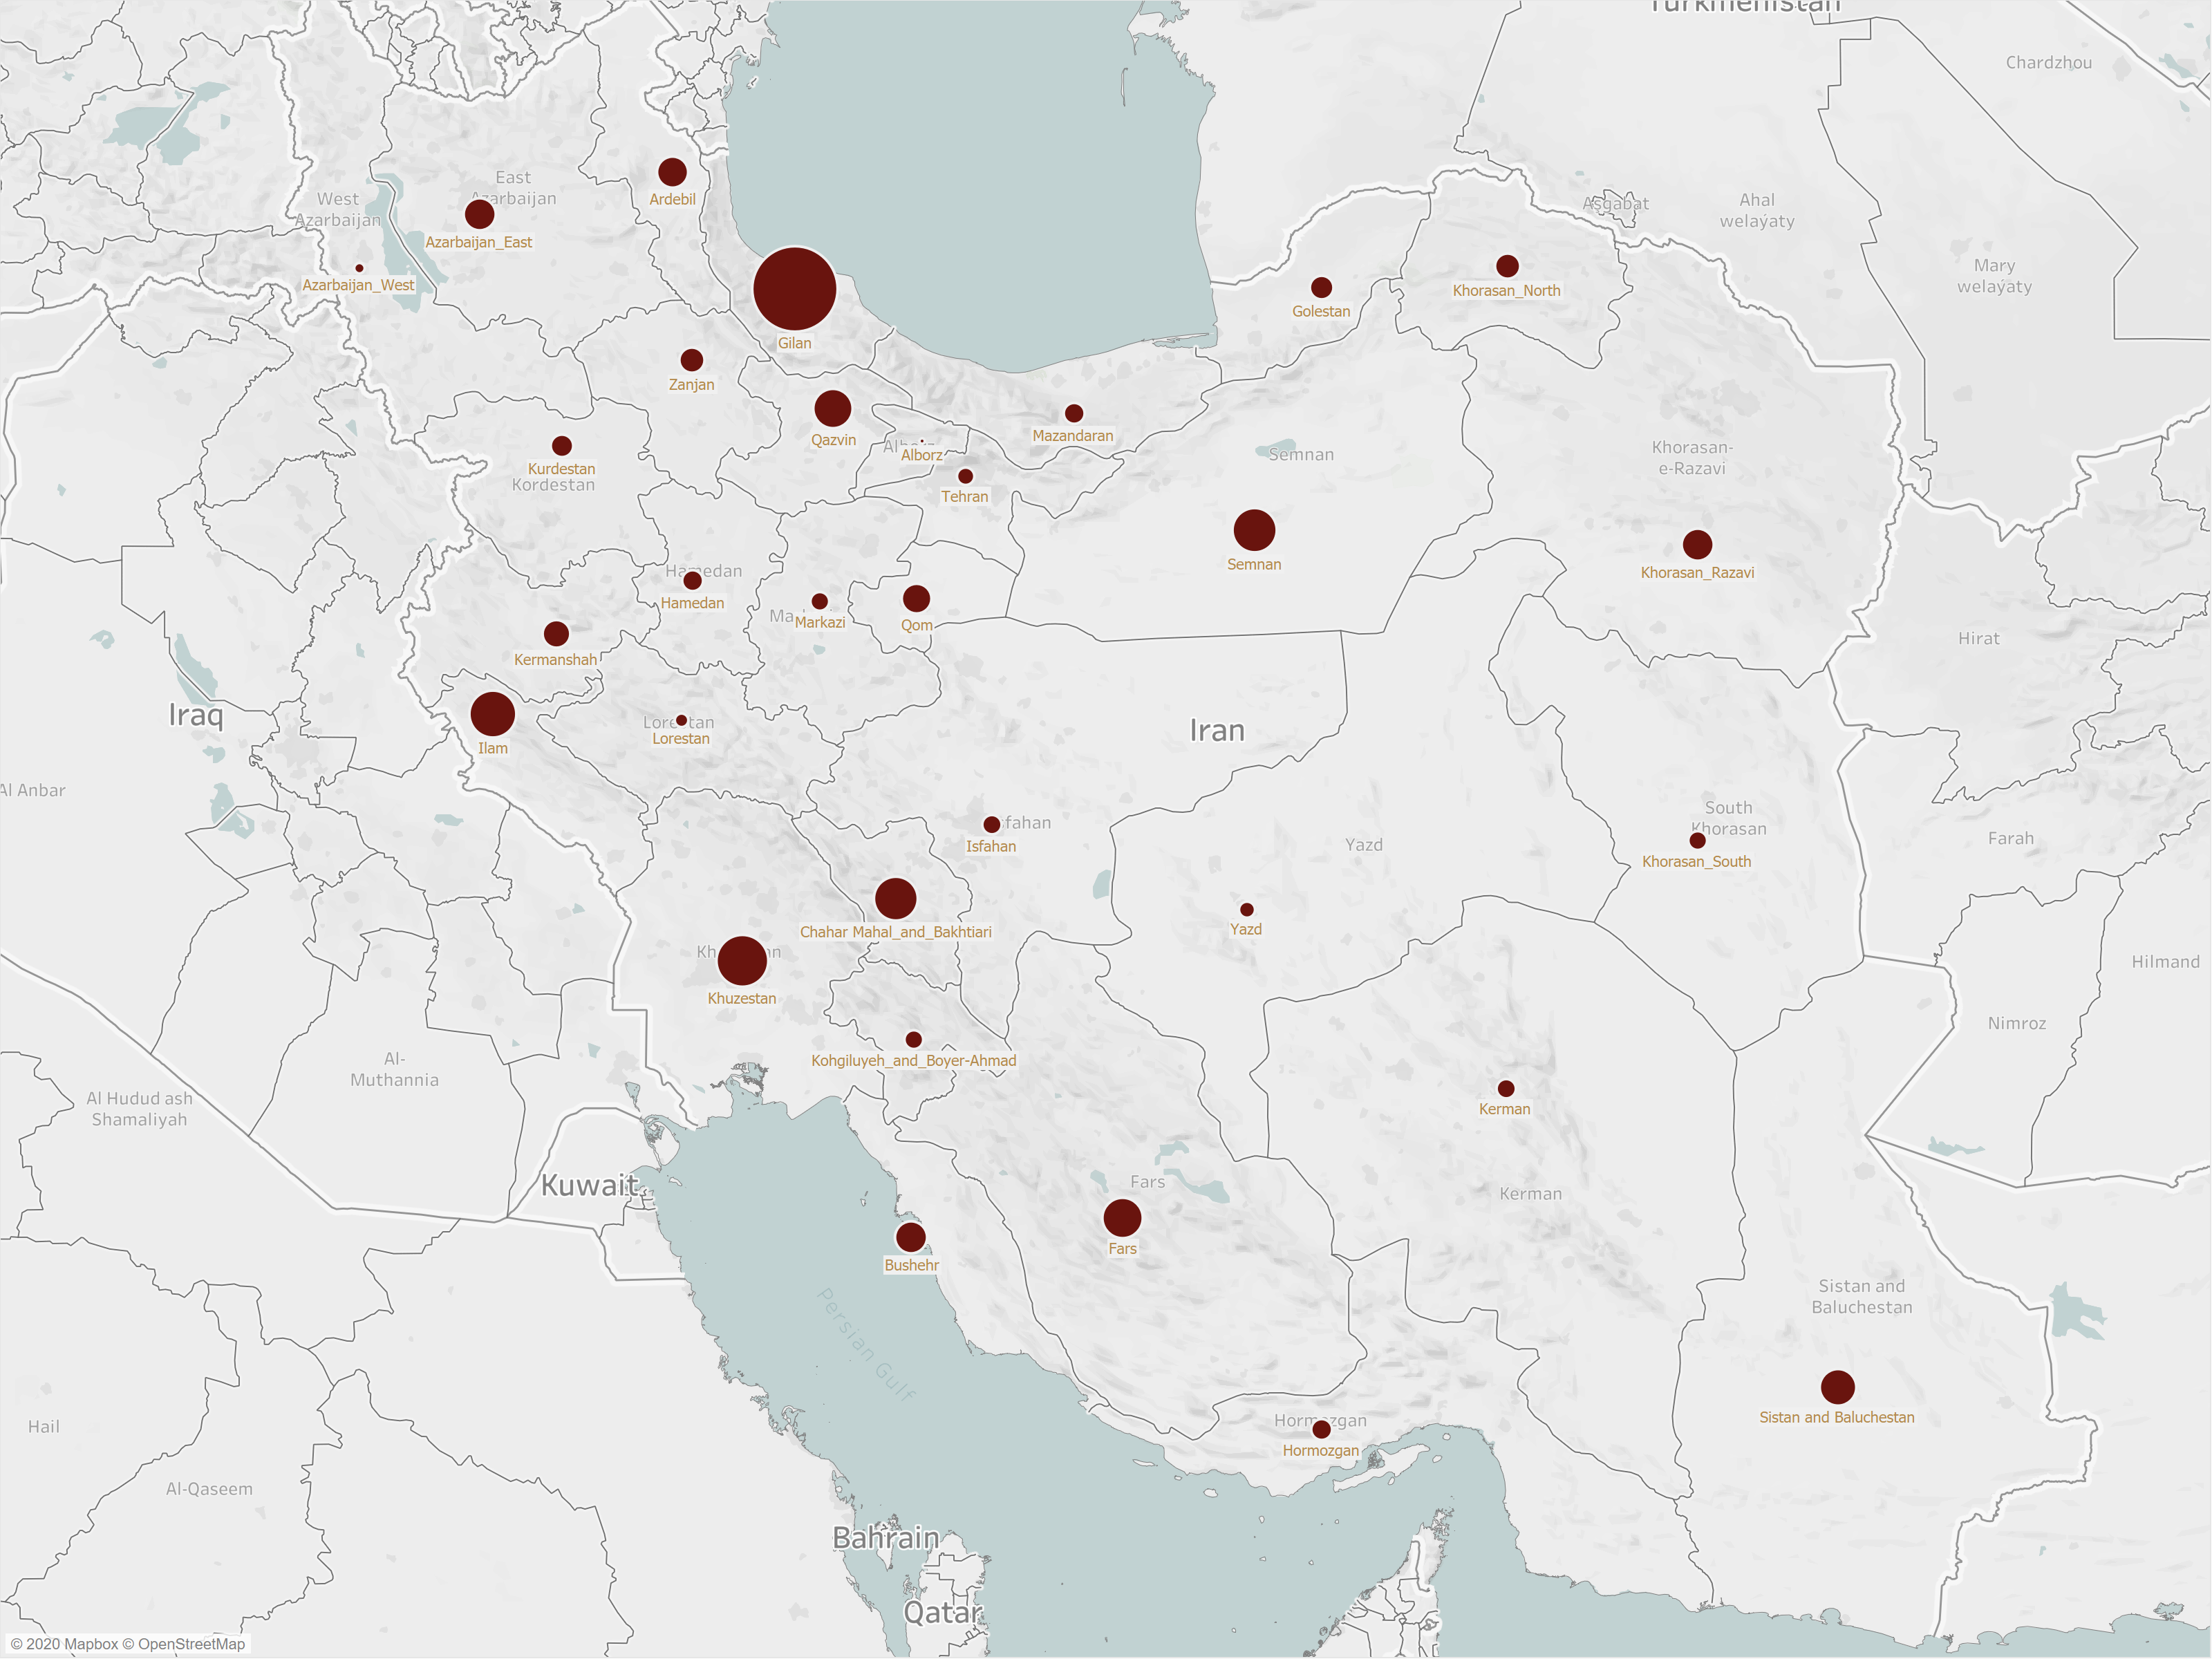
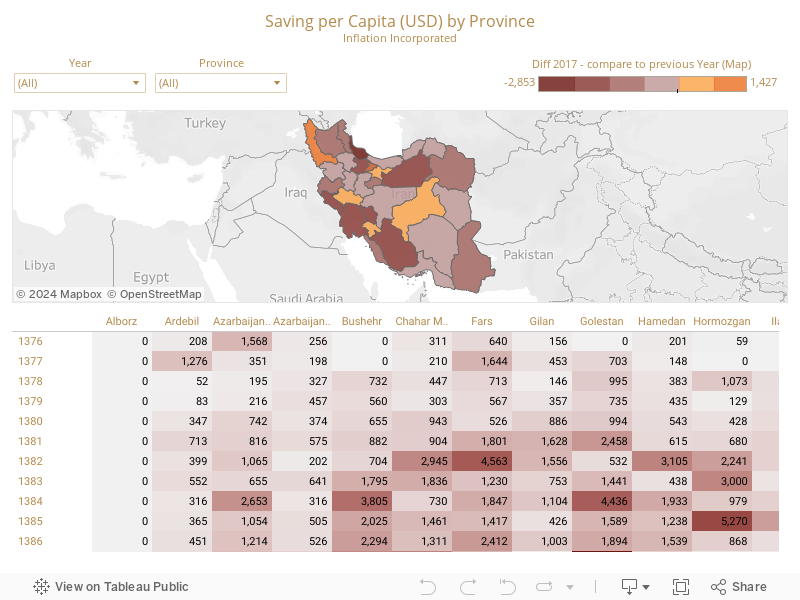
Saving Accounts on the Province Level – 20 Years
The map below shows the value of saving accounts’ losses in 2017. Moreover, the table demonstrates saving account by provinces over the last twenty years.
Comparing 2017 to other major losses in previous years confirms that in 2017, Iranians suffered the worst losses in their savings as a result of inflation and the USD-Rial exchange rate. Data has not yet been published for 2018, but it is expected to be much worse than 2017 as a result of the soaring inflation and 4.5 times worsening of the USD-Rial exchange rate.
Finally, it is necessary to mention that this analysis only measures Iranians’ savings accounts over the years. In order to comprehend whether this means that Iranians have become richer or poorer, there are numerous other factors such as real estate, and savings in cash on hand, etc. that must be considered. This, however, is beyond the scope of this article.
Recent Comments