![]() July 9, 2021
July 9, 2021
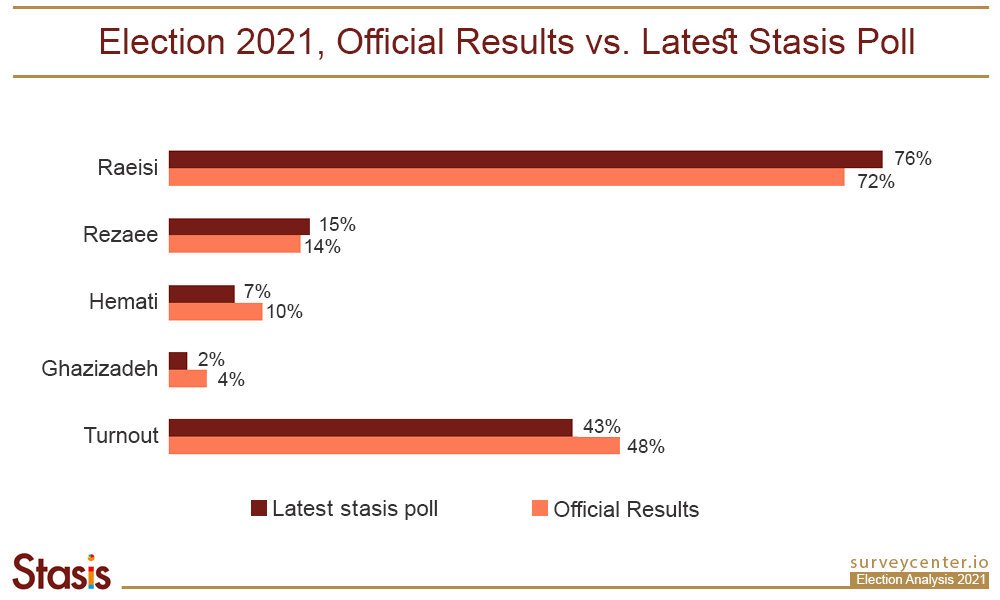
According to the official results of the2021 Iranian presidential election, Ebrahim Raeisi won the election by around 18 million votes. Raeisi received 72 percent of the vote among four candidates, followed by Mohsen Rezaee, Naser Hemati, and Amirhossein Ghaizadeh with 14 percent, 10 percent, and 4 percent respectively. Reportedly, 48 percent of Iranians voted in the election. Polls conducted by Stasis predicted participation rates of 43 percent (5 percent less than the official count). Stasis also predicted that Raeisi would win the election with 76 percent of the vote.
The chart below shows Stasis’ predictions based on the firm’s latest polls and the official outcomes of the election.
In this article, we analyze the 2021 Iranian presidential election based on the last Stasis poll, compared to the official results. The latest Stasis poll conducted on June 25-27 for IITV surveyed a sample of 1400 respondents by telephone. To see the results of this poll and our method use this link. You can also see all the election’s polls in this link.
Election Turnout: Official Results, 48 Percent
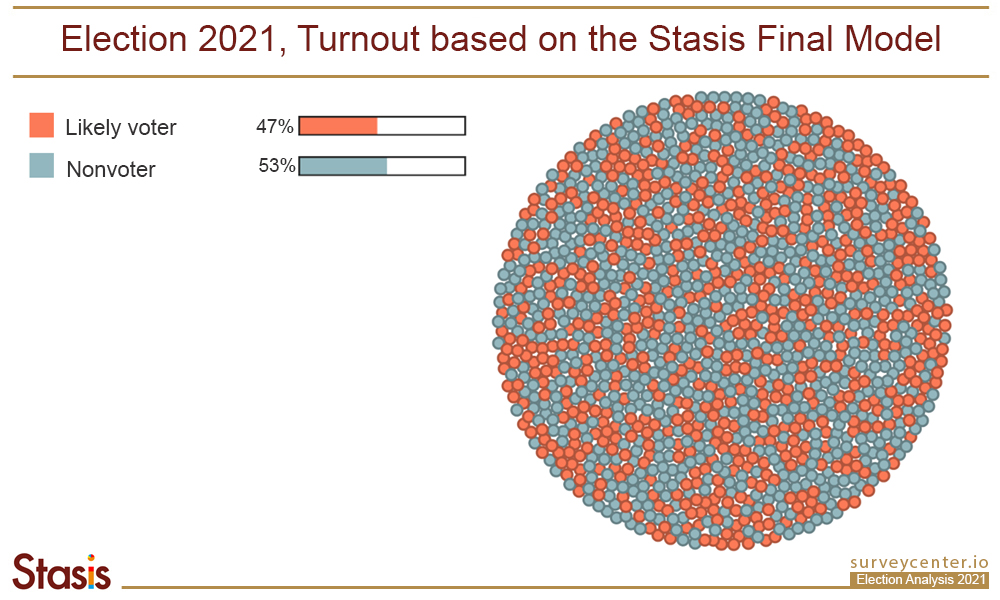
Based on the official results of the election, around 48 percent of Iranians participated by voting. In the latest Stasis poll, and according to our likely voter model, we predicted that 43 percent of Iranians would participate in the election. Moreover, 26 percent of possible likely voters were saying that they had not made their decisions.
Predicting who is most likely to vote in an election is a difficult task. So, Stasis developed a likely voter model by combining the results of several different survey questions. We first asked respondents whether they knew when the election would be held. Then, we asked how likely they would be to vote in favor of any candidate, with the response options including: most likely, likely to an extent, not much, or never. We also asked the interviewees to measure their likelihood of voting in the election on the 5-range spectrum from 1—the least likely—to 5—most likely to vote. We also asked if they voted in the previous parliamentary election. With the combination of these responses, anyone who said that 1- he/she is “most likely” or “to an extent likely” to vote in the election, 2- aware of when the election will take place, and 3- on a 5-range voting spectrum, chose numbers 4 or 5, were considered as a likely voter and comprised part of predicted 43 percent of respondents. After the election took place and based on the results, we optimized our likely voter model to include any respondent who rated themselves a 3 or higher on the 5-range spectrum as a likely voter. This new model, called the optimum likelihood model consisted of 47 percent of respondents. The following analysis is based on this optimum likelihood model.
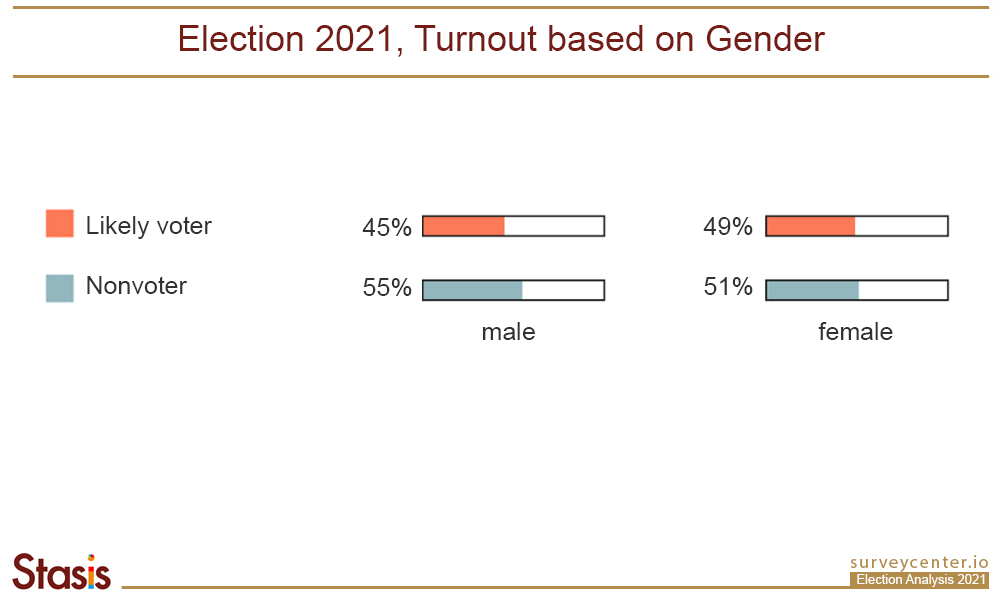
Turnout based on Demographic Variables
According to our optimum likelihood model, turnout among women was higher than among men. However, the difference here is not statistically significant.
Turnout in Iran’s 2021 presidential election among older Iranians is significantly more than that of younger Iranians. 59 percent of Iranians aged at least 60 voted in this election as opposed only to 44 percent of Iranians in the age group of 18 to 29 who cast their ballots.

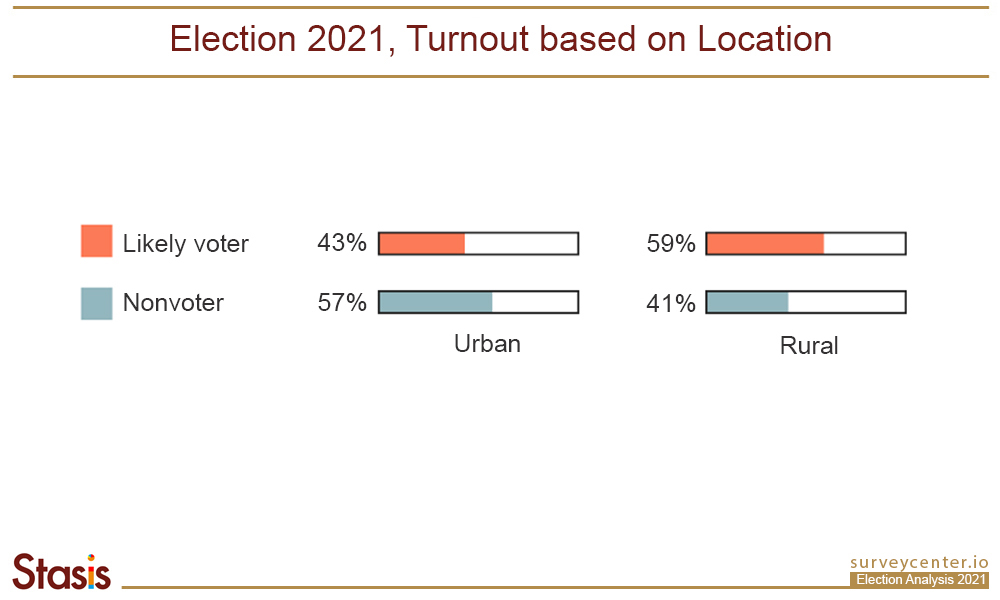
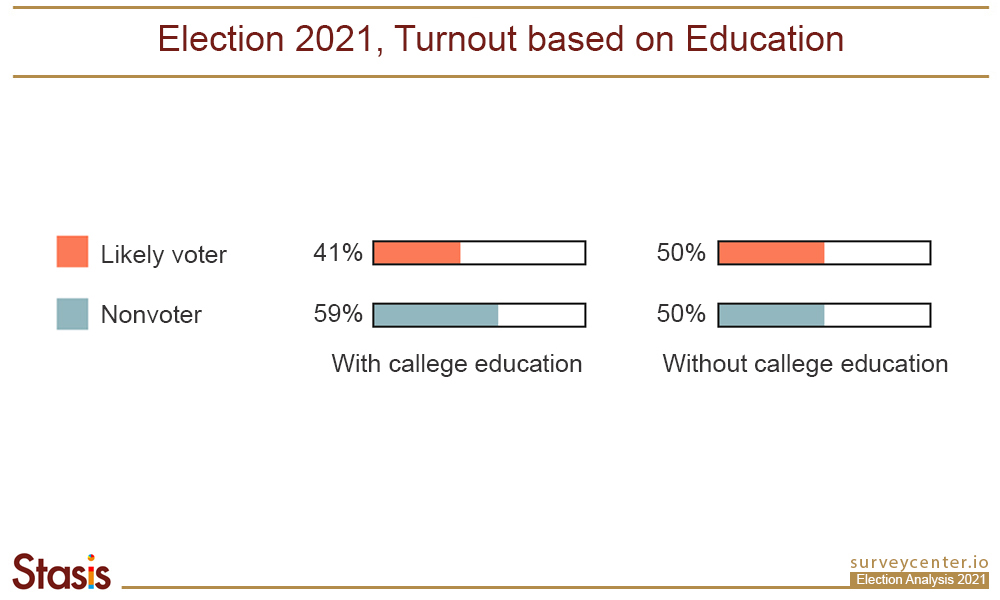
Iranians residing in rural areas and those with no college education voted in Iran’s 2021 presidential election at a higher rate than those living in urban areas or those with a college education. The difference here is statistically significant.
Turnout based on Income
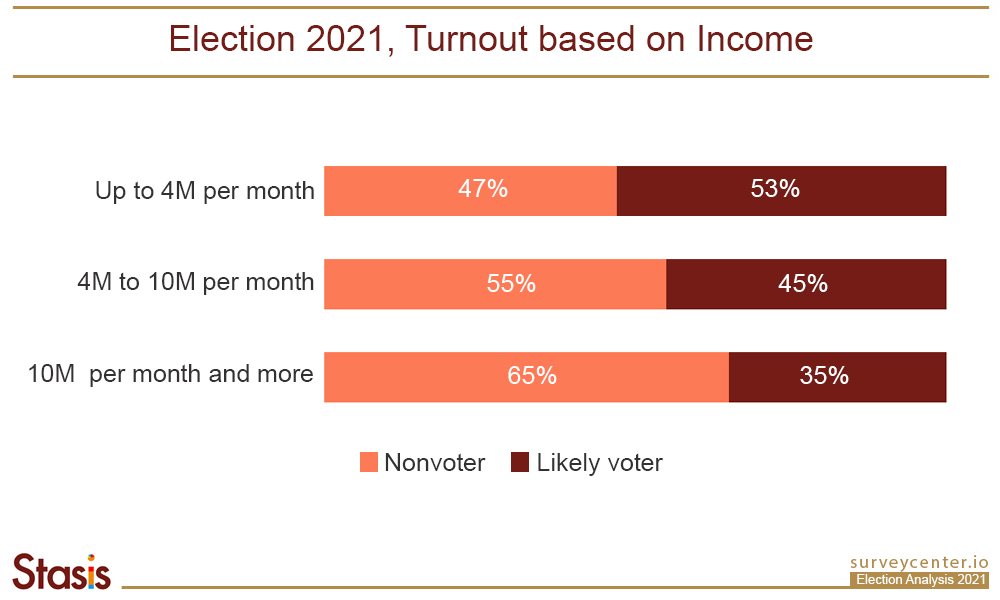
There is a relationship between participation in the election and the respondent’s income. Those respondents whose income is up to 4 million Toman per month ($160 with an exchange rate of 1 USD to 25000 Toman) were more likely to participate in the election (53 percent) compared to those respondents who earn 10 million Toman or more per month ($400). Among the latter, just 35 percent participated in the elections.
Turnout based on Political Tendency
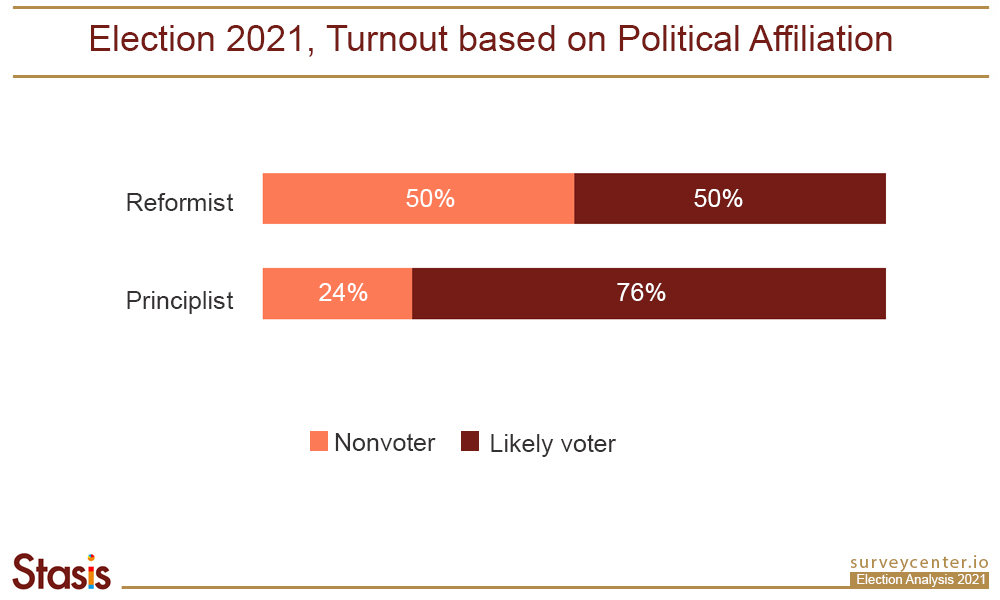
Those respondents who were leaning toward the Principlists were more likely to participate in the election as opposed to those who were leaning toward the Reformists. Around 76 percent of respondents who affiliate themselves with the Principlists voted. The level of participation among those affiliated with the Reformists was about 50 percent.
Undecided Voters
According to the optimum likelihood model (turnout: 47 percent), around 26 percent reported that they had not made their decision prior to the election date. Our previous analysis showed that these undecided voters ultimately vote the same way that decided voters would choose their candidates. The difference in Iran’s 2021 presidential election, compared to previous elections, was the number of blank or void votes, which came in at rates higher than ever before in Iranian history. Based on the official results, around 3.7 million Iranians cast their ballot as, in some way, void ballots. They might have put the name of another person on the ballot, or left it blank etc. This level of void ballot comprises around 13 percent of the total vote, 6 percent of the total eligible voters, and exceeds the votes earned by the second most popular candidate, who received only 3.4 million votes. In the 2017 presidential elections, 1.2 million void votes were counted (3 percent of the total vote, and 2 percent of the eligible voters). The void votes in 2013 were about the same as in 2017.
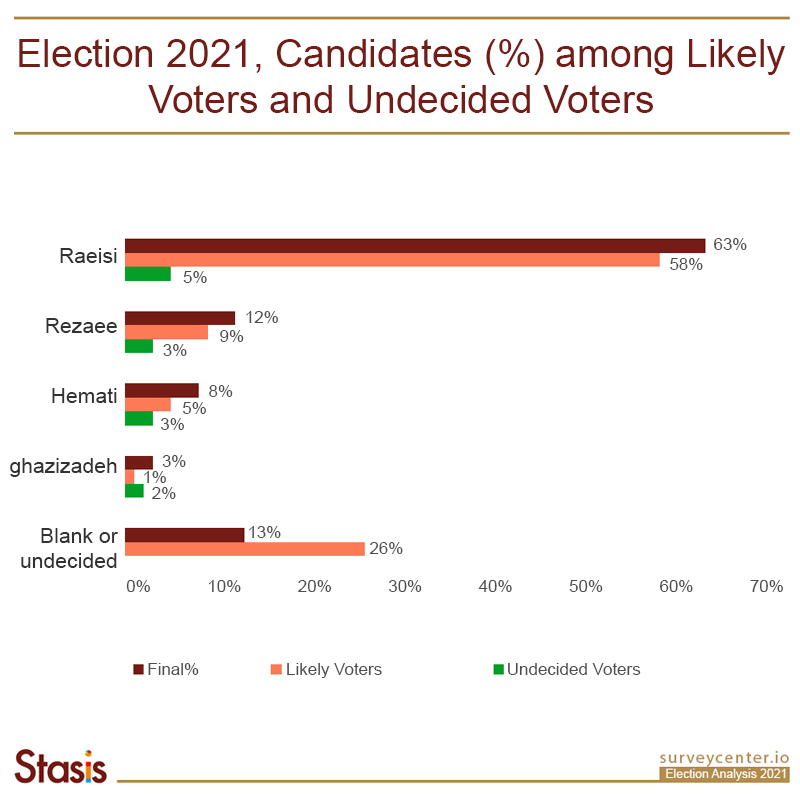
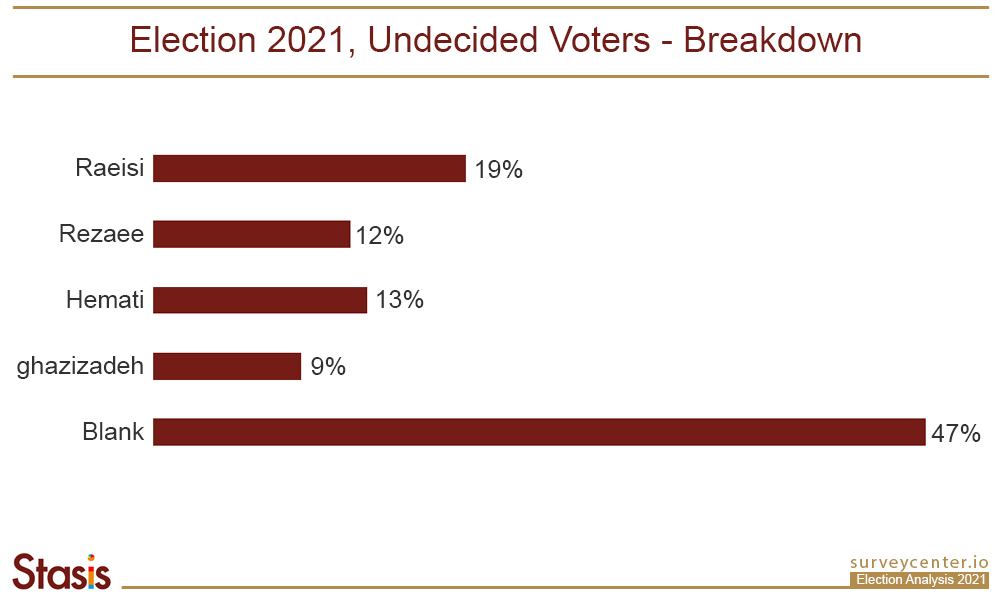
Our analysis shows that among those likely voters who had not made their decision of preferred candidates in the latest Stasis poll, 19 percent ultimately voted for Mr. Raeisi, followed by 13 percent for Rezaee, 12 percent for Hemati and 9 percent for Ghazizadeh. About 47 percent of these undecided respondents ultimately cast void votes.
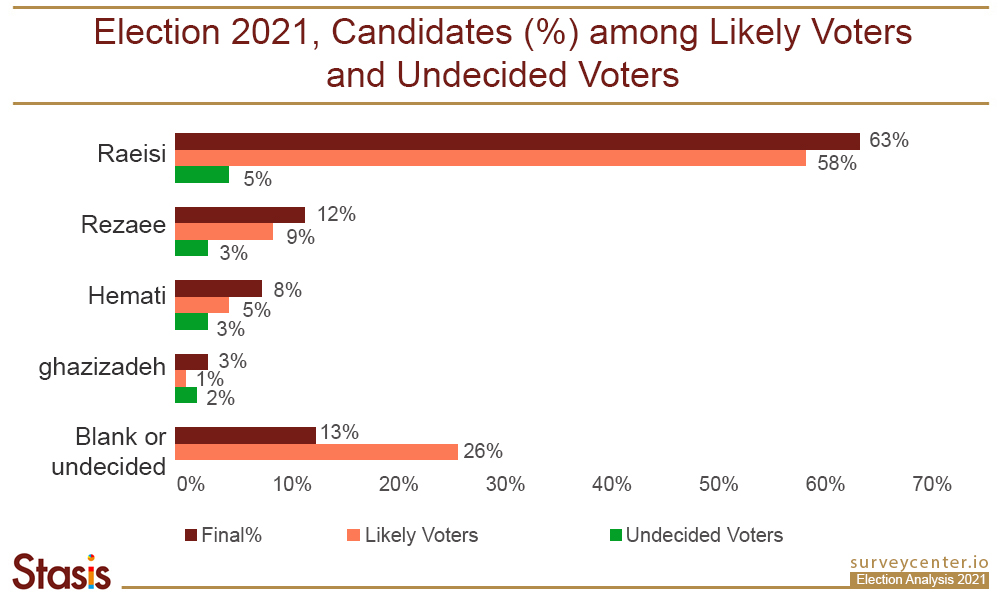
Candidates Votes among the Likely Voters (Optimum Model)
An estimation of the undecided voters who ultimately picked any of the four candidates in the election and the 47 percent who cast void ballots is shown below.
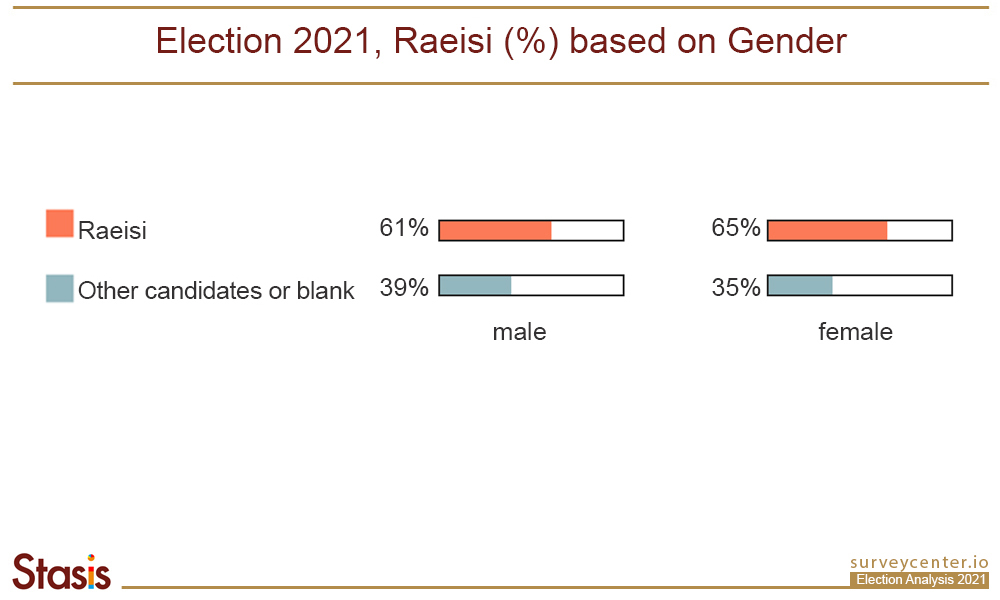
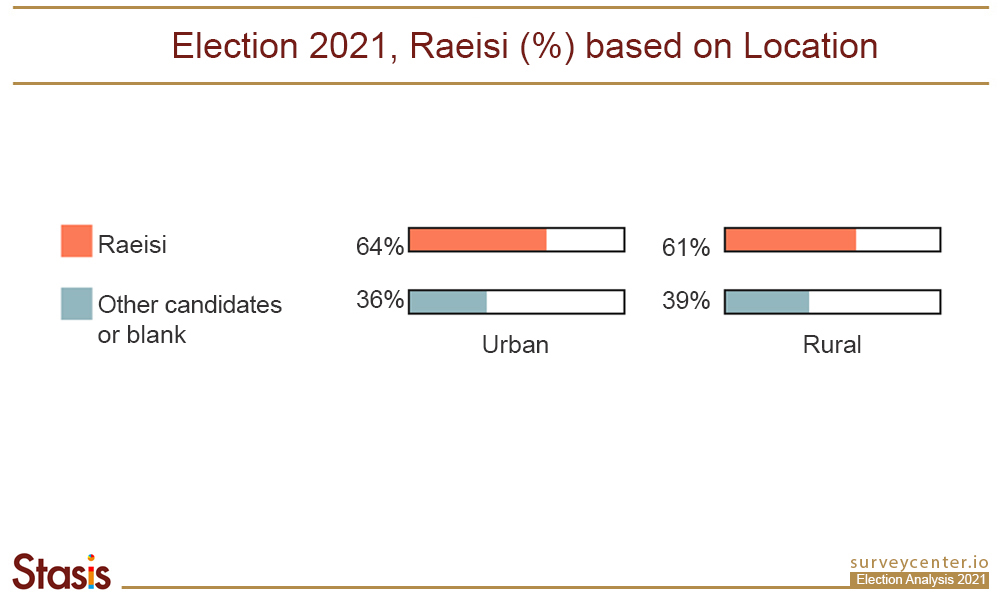
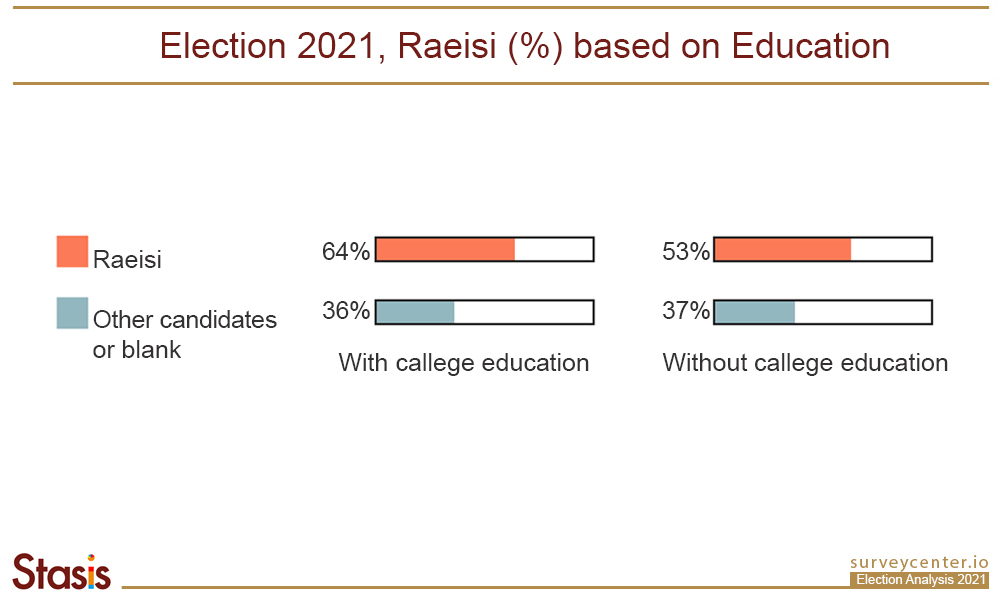
Votes for Raeisi by Demographic
Votes for Raeisi across demographics do not show any significant difference. However, we can say that female respondents and those aged 18-29 were more likely to vote for Raeisi compared to male respondents and those aged 60 and older.

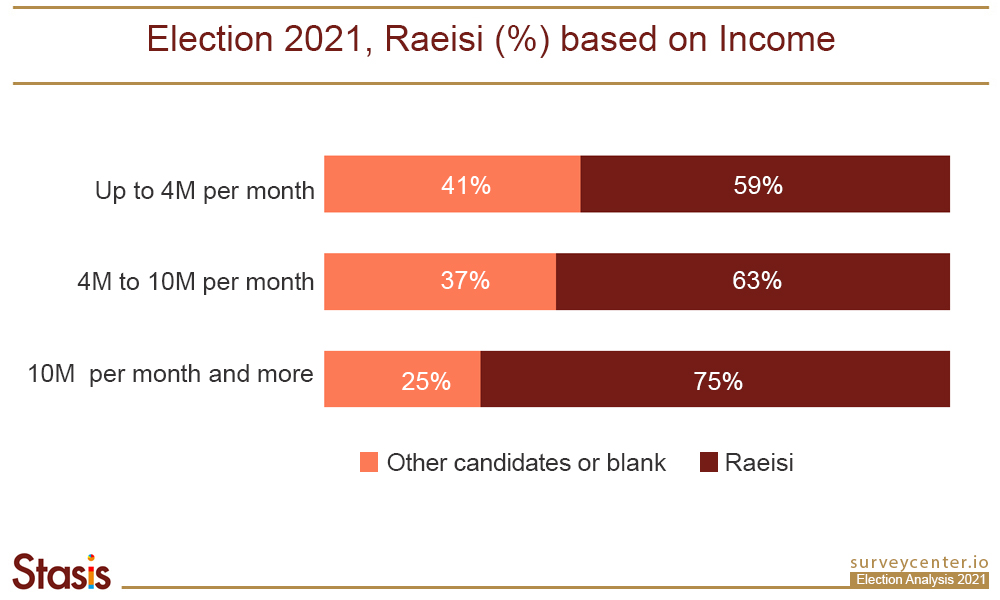
Votes for Raeisi based on Income
Those voters earning 10 million Toman or more per month (about $400 with the exchange rate of 1USD to 25000 Toman) were more likely to vote for Raeisi. Around 75percent of this group among the likely voters chose Raeisi as their candidate, as opposed to just 59 percent of those who earn 4 million toman per month ($160) that voted for Raeisi in the election.
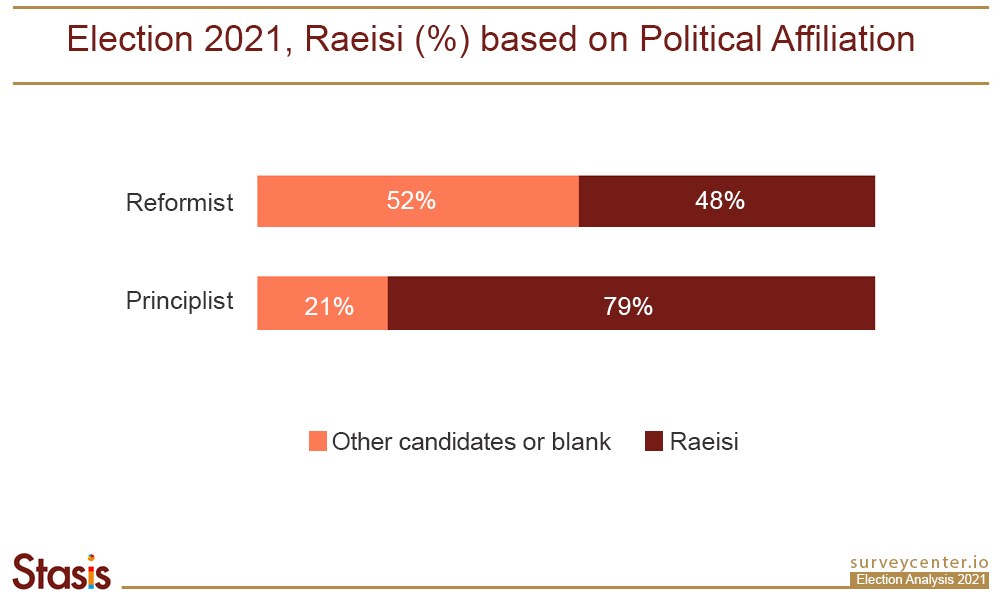
Votes for Raeisi by Political Affiliation
Among those voters who reported their political affiliation with the Principlists, 79 percent voted for Raeisi. However, Raeisi also received 48 percent of the vote among respondents who affiliated themselves with Reformists.
Our Method and Interactive Platform
For this analysis, Stasis used the latest poll data, conducted on June 25-27 with a telephone sample of 1400 respondents. To see the method of this poll, follow this link.
The interactive visualization of this analysis can be seen in this link. This is an interactive platform detailing the results of every question, distinguished by gender, age group, location, and education in a bar chart. For each question, there is a bubble chart (consisting of many small circles), detailing the respondents’ information. Each circle represents a single respondent; by clicking on it, you can find the complete answer set for that particular respondent. The color coding is consistent between the bubble chart and bar chart for easy comparison.
Further Information
In general, in elections polling, there are two potential main sources of error in predicting the results. The first one is determining who will actually cast his/her ballot on the election date (likely voter). The second factor is the effect of undecided voters on the outcome. In Iran, there are an additional two factors that might be involved as third and fourth sources of error. Factor three is the duration of time during which people can cast their ballots. Generally, the executor of the election (Ministry of Interior) announces that voters can cast their ballots until 7 or 8 p.m. on election day. However, the law allows the executor of the election to extend the voting time frame. In the 2021 presidential election, this window was extended a couple of times, until the 2 a.m. on the following day. Finally, the fourth factor that could potentially be considered as a source of error is whether some other election is concurrently taking place. In this presidential election, Iranians could vote in the municipal elections as well.
Regarding the first factor, we at Stasis use our likely voter model, developed based on previous experience. Generally, when we ask the respondents whether they will vote on election day, exaggeration of the likelihood of participation is quite common. In each of the 4 four times that Stasis polled about Iran’s 2021 presidential election over the course of a month, more than 50 percent of respondents claimed to be “most likely” or “likely to an extent” to vote on election day. However, to build our likely voter model, we ask the respondents some other questions, such as whether they know the exact date of the election, if they follow election news, whether they voted in previous prudential or parliamentary elections, measuring their level of participation on a 5-range spectrum, and even if they believe that Coronavirus could potentially affect their likelihood of turnout. The full explanation of the method used in our latest poll is described in the previous sections of this analysis.
The second factor, which was the main source of error in Stasis’ predictions, is undecided voters. More specifically, it is those do not state who they plan to vote for or cast their ballots in ways considered void votes. More than 3.7 million Iranians cast void votes in this election, far more than in any other election in the past. The fourth factor could be an issue here as well. There are several reports showing that even those who wanted to vote in the local elections (municipal elections) and did not intend to vote in the presidential election received presidential election ballots at the polling station. Some of those voted in favor of people who were not in the final list of candidates or left it as blank. However, since there is no detailed report of these kinds of voters, we can not estimate how many of them did not want to vote and yet were forced to vote in the presidential election anyway.
And as the final source of error, we could refer to the extension of the election time and how it impacted voters who initially did not intend to participate, but ultimately cast a late ballot. External news or social media may have influenced these voters to take advantage of the extended voting window.
Through further analysis of the elections’ results and comparison with previous elections, Stasis will optimize its voting model for future elections.
Recent Comments